The Challenges Posed by the "Duck Curve" to Solar Farm
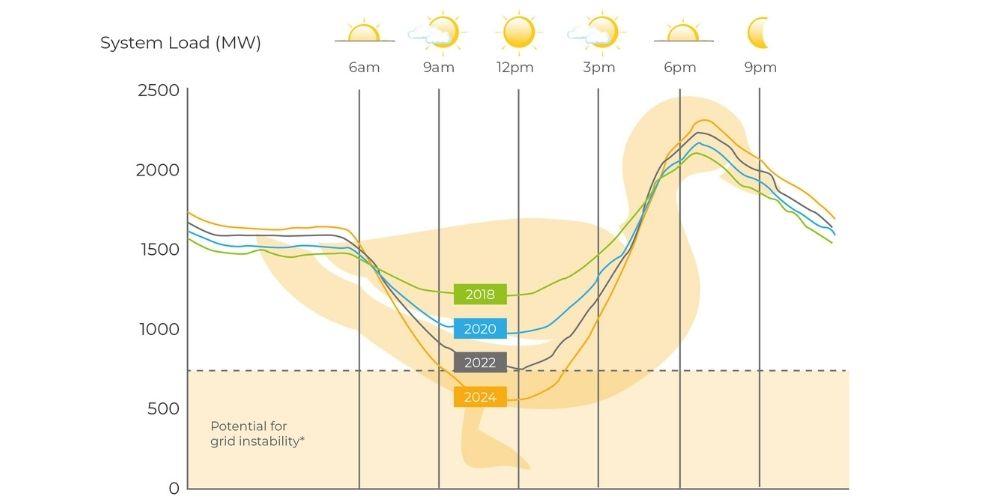
The “Duck Curve” refers to the duck-like net load curve formed by PV power generation in the daytime peak output hours, resulting in excess power supply, and in the evening, after the power output is reduced, the power demand rises rapidly.
This phenomenon presents new challenges for the operation of power systems and market design. This article explores the "Duck Curve" in the electricity market from the following perspectives:
Historical Background
The 2014 amendment to the flexibility resource adequacy requirements submitted by the California Independent System Operator (CAISO) marks the starting point of widespread attention to the "Duck Curve" phenomenon.

Definition
The “Duck Curve” of the grid is a graph that describes the change in the net load of the power system over the course of a day, a concept that originated in the California Power System Model, so named because of its resemblance to a duck. It is characterized by high photovoltaic generation during the day, low net energy demand on the conventional grid, and a rapid rise in demand at sunset.
Case Analysis
California Market (CAISO): Analyzing the market mechanisms and battery storage applications in regions with high solar penetration. California, known as the "Sunshine State," boasts abundant solar resources with strong radiation and an average of over five hours of peak sunlight. According to new legislation, the share of renewable energy generation will reach 50% by 2030, further lowering the "Duck Curve" backside and elongating its neck.
The CAISO market is a typical region with high solar penetration, where management has designed and approved corresponding flexibility capacity mechanisms based on predicted trends, creating one of the world's most mature battery storage markets.
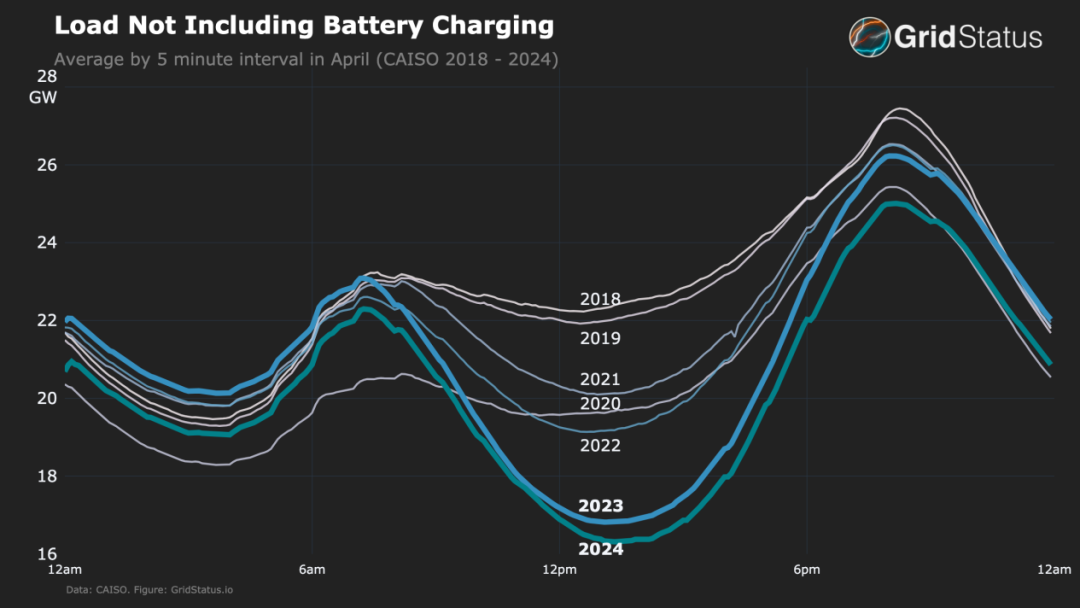
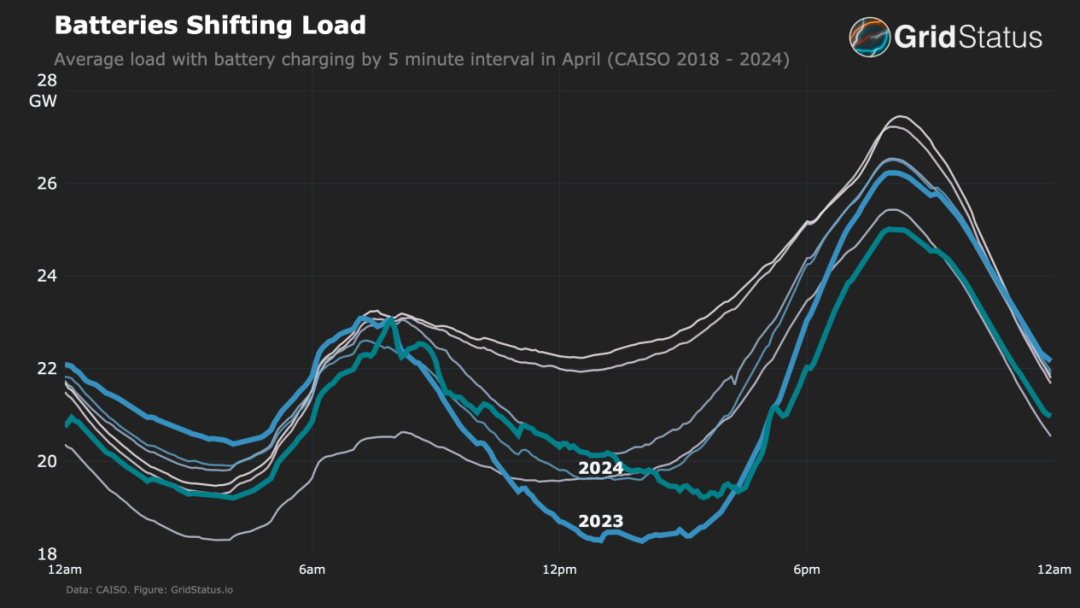
With the recent large-scale deployment of battery storage facilities, the average load curve during typical CAISO periods has undergone a paradigm shift, with the 2024 "Duck" appearing slimmer than in 2023. The emergence of this phenomenon means that the impact of midday battery charging loads on the system goes beyond the impact of PV generation, and that other types of flexibility resources face operational pressures.
Solutions
- Developing smart grids: Making power plants and grids smarter to match changes in electricity loads.
- Developing electricity storage: Storing electricity from photovoltaic or power plants first and then using it at peak times.
- Preventing over-generation: When solar energy exceeds grid usage, operators may have to reduce solar power generation.
Summary
The "Duck Curve" is a graphic representation that illustrates the challenges faced by an electrical system with high solar energy penetration, as is already the case in California and, more recently, in Spain. During the middle of the day, photovoltaic production surges, causing a drop in net demand (the electricity that must be covered by other sources), which in turn reduces the wholesale price of energy to as low as zero. However, at dusk, when solar generation disappears and domestic consumption increases, the system must respond quickly, making electricity more expensive and testing the grid's ability to adjust. This curve shape, with a deep "belly" at midday and a pronounced "neck" at dusk, represents both an opportunity and a challenge for electricity operators.